– Access the Portal –

Authorized users, can log in from anywhere, on any device, anytime, and see all of the monitoring data in one place. The portal is also where admin can add users, set custom alert limits, access audit-ready reports and analyze historical data.
– A Friendly User Interface –
We want you to be able to see key data as quickly and efficiently as possible, which is why we designed our portal with two words in mind – simple and intuitive. Not only can users see multiple environments across multiple locations all in one place, but they can access any report in 3 clicks or less and perform daily check-ins with just one click.

– The Dashboard –

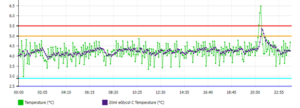
The Dashboard is the first page viewed after logging into the portal. For each zone, users can see a 12 HR graph, current alert status, and the most recent value for each environment you are monitoring – all the most important data, all at once
– Customizable Alerts & Notifications –

Alerts are configured to customized specifications and escalations are user-defined. All alerts, escalations and corrective actions are securely recorded and can be accessed as auditable reports. Alerts can be delivered via text, email, phone, or a combination of the three.
– Trend Charts –

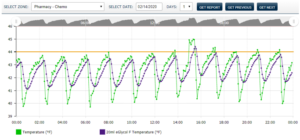
With our customizable trend charts, users can monitor trends in data over days, weeks or months. This helps identify potential equipment problems before they occur.


– Audit Reports –
Fully compliant audit reports, specifically tuned to your compliance and audit requirements, are just one click away – anytime. All user activity is logged, traceable and securely stored.
Our Analytics Cover More than Just Data…
Managers use the portal to view user access history and behavior to see if alerts or other issues are being resolved in a timely manner. This helps them understand whether compliance is being maintained across the board. Historical data helps engineering or maintenance personnel assess and rectify faulty hardware, from simple refrigerators to entire HVAC systems.


