In an ideal world, environmental monitoring of perishables would simply place the monitor and wait for a response. This thinking could be compared to attending school, then waiting until the end of the term to learn your grade, possibly your pass-fail fate.
There is increasing regulatory pressure being placed on the environmental storage conditions of perishable products during manufacture, storage, and transportation. These requirements are being established by, but not limited to, the Food and Drug Administration (FDA), Center for Disease Control and Prevention (CDC), Code of Federal Regulations (CFR), United States Pharmacopeia (USP) as well as non-US counterparts.
These agencies regulate:
- Monitoring
- Temperature
- Humidity
- CO2
- Differential Pressure
- Control Limits
- Recordation
- Alert and Alert Response
- Equipment Calibration
Compliance with agency regulations can be reactive or proactive. A reactive response would be one that is following the methodologies outlined for proper and accurate monitoring and only responds when alerted or otherwise notified. Whereas proactive compliance would employ data analytics that provides the user with methods by which monitoring and management of the collected storage data may be accomplished. These methods would show strengths and weaknesses in the monitoring and management of the overall compliance, thus allowing the user to focus on addressing any potential liability and preventing loss due to non-compliance.
Background
There are two primary contributors to potential non-compliance: human and machine. The human, in this case, refers to the user meeting the specifics of the regulations in the mandated periodic data viewing and recordation, alert management, and documentation. The machine factors include the external environment, i.e. energy supply (AC Power), storage unit operation and performance to name a few. Each of these factors contributes to the regulatory compliance in part and as an aggregate.
By recording and displaying the compliance of the users to perform the necessary and mandated documentation, any necessary and appropriate training can be implemented, for example. This albeit a small step results in adherence to regulatory guidance and better performance statistics. Similarly, machine performance can be measured and displayed. Predictive analytics may be utilized to monitor the storage unit. From this information, preventative maintenance may be cited to address an issue before It becomes serious. In the event of a power failure, the system can be designed to alert the user in sufficient time to prevent spoilage of the stored goods.
In quality improvement, managing data is an essential part of performance improvement. It involves collecting, tracking, analyzing, interpreting, and acting on an organization’s data. Data management also includes ongoing measurement and monitoring. This enables an organization to identify and implement opportunities for improvements to the current process.
While basic reporting continues to be a must-have, advanced predictive and prescriptive analytics can generate powerful insights.
- Reporting. The most basic version for an analytics solution, that focuses on building data repositories and reporting the current situation using bivariate data.
- Descriptive analytics. Generating actionable insights into the current situation using complex and multivariate data.
- Predictive analytics. Predicting the likely future outcome of events, often leveraging structured and unstructured data from a variety of sources.
- Prescriptive analytics. Prescribing action items required to deal with predicted future events using data from a variety of sources.
The use of analytics helps organizations ensure regulatory compliance while minimizing those costs and mitigating the cost of non-compliance. The people, process, and technology put in place to manage the regulatory reporting requirements also help organizations improve internal reporting and tracking, as well as use this foundation for complex, high-impact analytics. As a result, the burden of regulatory compliance can be converted into an opportunity with high-value analytics.
Human Contribution
Mandated by regulation, requirements are established that dictate human interaction with the monitoring system. With the evolution of cloud-based, real-time monitoring and prescribed alerting, the dependence on human interaction may be reduced, but not eliminated.
- Portal Usage – The greater the use of a tool, the greater the familiarity it will hold. It is, therefore, necessary to monitor the frequency of user interaction with the portal.
- User Check-in – A requirement set forth by some regulatory bodies is the need for daily check-in. That is, the data must be viewed and verified to be within the control limits. This requirement ranges from once daily to twice daily. Check-in may not be required on weekend days and holidays.
- User Training – though not prescribed by regulatory guidance, offering and tracking user training contributes to the proper usage of portal information.
- Alert Response – Alert notification is an integral part of ensuring the safety of the stored materials. The human response is equally as important. The measures that can be monitored are:
- Time to Acknowledge – The time to acknowledge an alert is critical to the proper and safe management of the stored contents.
- Time to Reset – The time to reset an alert indicates the urgency to address the problem that resulted in the alert.
- Undocumented Alert – The documentation of the alert cause is an important part of the formal recordation.
- Unresolved Alerts – The commitment to manage and close the alerts promptly is critical. Thus, it is necessary to address and close all alert notifications at each level.
Machine Contribution
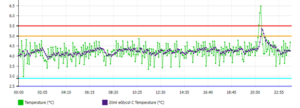
The present application relates to a process and a system for temperature monitoring of samples or other goods stored in a temperature-controlled environment, such as a refrigerator or freezer. Refrigerators and freezers are generally equipped with temperature sensors, which emit an electric temperature signal. That temperature signal is in turn used by an electronic control system to regulate the operation of a compressor such that the temperature in the refrigerator remains in a preset nominal range. Such sensors are often attached to a wall of the storage space of a refrigerator and, essentially, detect the prevalent ambient air temperature in the storage space. The ambient temperature inside the storage device, however, is frequently subject to strong short-term fluctuations, such as when a door of the refrigerator is opened, equipment malfunction or complete shutdown of the compressor.
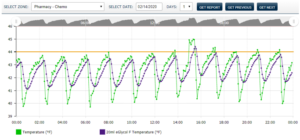
To attempt to maintain a semi-stable temperature in the refrigerator, the compressor needs to be turned on and off. To maintain a set temperature, a refrigerator cools the interior space to below the desired temperature and then stops cooling. When the active cooling stops, the internal temperature slowly rises until the air temperature reaches a tolerance level above the set temperature where the controls restart the compressor. Active cooling of the interior space begins again until the interior space reaches a temperature below the set temperature. This cycle continuously repeats itself. This activity results in the measured air temperature to be cyclic. The very nature of this cooling cycle presents challenges in the measurement and the determination of the precise internal temperature of the goods being stored. While the cooling cycle itself provides variation in temperature, other external events create even more variation, such as opening and closing the door or adding or removing goods, equipment malfunction or power failure.
Through the measurement of a single air temperature probe, multiple data streams can be extracted and utilized as performance monitors and measures without loss of data integrity. The use of telemetry in the measurement and monitoring of equipment is not only necessary but essential to the successful prediction of the unit operation as well as the demonstration of a close approximation of the contents. The telemetry available from the raw air temperature probe will provide valuable information on the unit’s performance both near and long term. Below in Figure 1 is an example of the composite compliance score CQ™.

Figure 1 – Portal Display with Compliance Quotient (CQ™)
The purpose of the compliance algorithms is to provide the end-user a score that is viewed with the intent of a change in process, procedure or behavior. Given the data available from the compliance score, alerting limits can be established; once exceeded, the end-user can be notified as to an out of tolerance condition.
Noted in the Implementation section, an overall score is derived as an average of the underlying scores. This value and its trend would guide the overall condition of the regulatory compliance for that data stream. The underlying subcategory scores can be displayed complete with supporting detail as to the cause.


